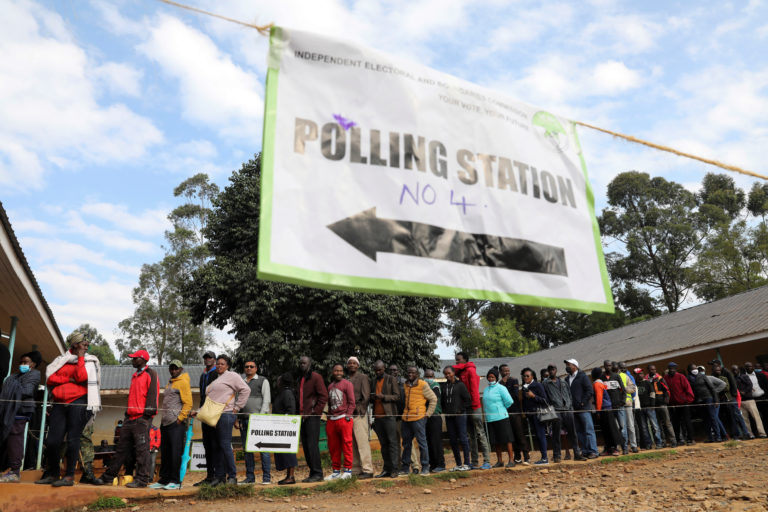
Not on Facebook. Not at the rally. In a polling station — one classroom, one tent, one queue of no more than 700 voters. We build the electoral data network that shows your campaign which rooms decide the race, and what to do about them.
For aspirants, parties and electoral service providers · Surveys + public records only
The model — in plain language
Instead of spreading a campaign budget thinly across a whole ward, we rank every station in your ward — stronghold, swing or weak — then put a named captain, a supporters list and a live data feed on the handful of rooms that actually decide the result. Resource planning in its simplest form: put people, money and message where they move votes.
One kit, one team, one Form 34A per room. Campaigns that plan on the same unit stay in step with how the election is actually administered.
2017 and 2022 results are public, station by station. Where the margin moved last time is where it can move again.
One captain, one Agentic cluster, one supporters list per station — ground organisation at a scale a human can actually run.
In most wards, a minority of stations carry the winning margin. The model finds them before your opponent does.
What your campaign sees
The same evidence discipline behind Kenya's public election dashboards — pointed at your race. Pick a view to preview it below.
Registered voters vs mapped supporters — by station type
Registered voters Mapped supporters
Ward turnout — 2017 vs 2022 vs 2027 target
Door-to-door surveys — daily collection, last 14 days
Top voter issues — share of mentions
Hourly turnout vs 2022 — same stations, target pace
2022 actual 2027 live Target pace
Stations behind target — 13:00
| Station | Turnout | Gap | Action |
|---|---|---|---|
| 014 · Kiembeni | 33% | −8 pts | Boda mobilizers |
| 022 · Baptist | 35% | −6 pts | Church networks |
| 031 · Beach Rd | 38% | −4 pts | SMS + walk blast |
Rule of the day: any station under 40% by 13:00 gets a mobilizer visit before 15:00.
How a campaign runs on it
We clean and segment the voter register for your ward — station by station, age, gender — and layer on 2017 and 2022 turnout per room.
Every station is classified stronghold, swing or weak. The swing rooms become your campaign's centre of gravity.
500 door-to-door interviews per ward, sampled across stations, capture who is voting, for whom, and which issue moves them.
Your dashboard updates weekly: reach, supporter growth, top issues, gaps. You adjust message and money with evidence, not rumours.
Agents report per station, turnout is tracked hourly against target, and Form 34As are tallied against projections as they land.
What we do for you
Delivered with the same care an independent scrutineer brings to a count — accurate, documented, and defensible after the result is announced.
500 500 disaggregated surveys, sampled per station (Digital / Household). Issue polling on water, roads, jobs and health. A named captain and supporters list for every station, plus Agentic-cluster and agent databases with name, ID, phone and village.
Register cleaning and segmentation by station, demography, psychographics. Every station ranked stronghold, swing or weak. Turnout history per room from 2017 and 2022. Influence mapping: messaging, narrative tracing, trends.
A weekly campaign dashboard covering reach, issues and gaps. Segmented constituencies — Traditional, New, Issue-based voter. Media listening on Electronic, Socials & Locals in your area. Plain-language briefs for the candidate, not spreadsheets.
Election-day agent deployment tracking, live. Hourly turnout monitoring per station against target pace, surge detection, and a last-hour push list that says exactly where to send people. Form 34A results versus target as they land.
The offer
Most aspirants have a campaign budget but no data team. We become that team — ranking every polling station in your ward as stronghold, swing or weak, then building a ground game and data network on the rooms that decide the race.
40 / 40 / 20 — deposit, mid-campaign, on delivery
Best window: 6–1 months before election day
Surveys + public records only — nothing illegal, nothing invented
One client per ward — your opponent can't buy the same map
Feasibility — why this is buildable today
Kenya is expanding from 46,229 polling stations in 2022 to 55,393 for 2027 — every one capped at 700 voters under the Elections Act. The unit we plan on is the unit the election runs on.
Each station produces one Form 34A. Historical results and turnout are published station by station — so strongholds, swings and weak rooms can be found in open records before a shilling is spent.
Kenya already runs public election dashboards — voter registration, results analysis, reforms tracking. Our pack plugs campaign-grade field data into the same evidence culture, on your side of the race.
Doorstep collection runs on OSINT Toolbox / ODIN OPENDATA — the open-source stack used by observer missions and research teams across Africa. Electoral management design is a studied, documented discipline worldwide.
We are not affiliated with the IEBC or any observer mission. We work for campaigns, using lawful survey methods and public records only.
The close
One data team per ward, built station by station — first signed, first served. The serious window opens six months before election day, and it closes fast.
PACK Swing-Station Victory Pack — KSh 80,000 per ward
TERMS 40% deposit · 40% mid-campaign · 20% on delivery
START 12–9 months before election day for full value